
JS Error Monitoring
The worst moment in an OTA release is when the update is already out, a screen turns white on one device model, and all you have is "a user says it won't open".
Since react-native-update v10.55.0, the SDK reports JavaScript exceptions that happen inside an OTA version to the update service. The console groups them by app, OTA version and fingerprint, and restores the minified stack back to your original source using the source map archived at publish time — including the lines around the throwing statement. Locating a production error usually no longer requires reproducing it.
It is included in every plan, at no extra cost. There is no separate crash-monitoring subscription, no event quota, and no extra SDK to install: if you already ship with Cresc, you already have it.
What it looks like
Open Version health in the console, pick your app, and the "JavaScript error issues" list sits at the bottom of the page. Click any row to open the details:
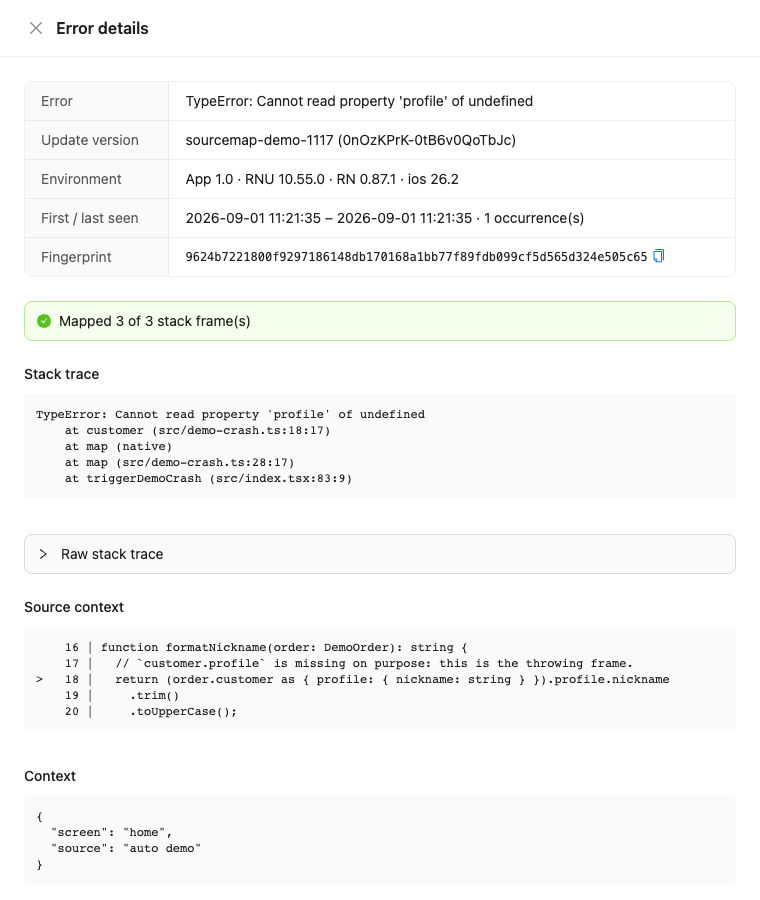
The drawer shows:
- Stack trace: restored to original positions and function names such as
src/demo-crash.ts:18:17, with a banner telling you how many frames were mapped (Mapped 3 of 3 stack frame(s)) - Source context: two lines on each side of the first mapped frame, with
>marking the throwing line - Raw stack trace: the original text with Hermes bytecode offsets, collapsed, so you can cross-check
- Environment: native package version, SDK / React Native / OS versions
- Context: the custom fields you passed to
captureException(see below)
The list can be filtered by uncaught / handled. Identical errors are grouped by fingerprint and counted, keeping a single representative stack.
What you have to do
Almost nothing. Reporting is on by default, and the source map needed for symbolication is archived automatically at publish time:
- the client runs
react-native-updatev10.55.0 or newer; - you publish with
react-native-update-cliv2.24.2 or newer (cresc bundlegenerates and archives the source map for that version automatically).
Source maps are kept server-side purely for symbolication. They are never shipped to clients and do not count against your OTA package size quota. Before uploading, the CLI strips inlined node_modules sources and compresses the file, so the archived copy is typically a tenth of the raw source map.
Only errors that happen while running an OTA version are reported. When the app is still running the baseline bundle shipped inside the native package (no update applied yet), nothing is reported — those crashes belong to the native release and should be covered by Sentry, Firebase Crashlytics, or a similar tool.
What gets reported
- Uncaught exceptions: the SDK appends a handler on top of React Native's existing global
ErrorUtilshandler (it never replaces or swallows it), so existing Sentry or Crashlytics integrations keep working, and the red box and your current reporting pipeline behave as before - Manual reports: your own code calling
client.captureException(error, { extra })inside acatch
A report carries the error name, message, stack, an optional React component stack and your custom extra fields, plus the current OTA version hash, the native package version and cInfo (the same SDK / RN / OS information as a checkUpdate request). Every field has a size cap (32 KB for the stack, for example) and is truncated beyond it. Reports are single fire-and-forget requests: no retries, failures are silent, and the same error object is only reported once. Nothing is reported in development (__DEV__).
Error data is retained for 31 days.
Reporting manually
Inside components, take client straight from useUpdate():
extra accepts strings, numbers, booleans and null only, up to 32 fields. Do not put personal data in it.
Turning it off
The console then receives no JS errors from that client. This switch is independent from the version health telemetry switch disableTelemetry: turning off disableTelemetry stops both, while disableErrorReporting only stops JS error reporting.
Common situations
The details say the OTA version has no archived source map: that version was published without one (the CLI was too old, or you used a custom bundling flow and published with cresc publish manually without --sourcemap <path>). The raw stack is still shown; publish a new version with a source map and later errors will be symbolicated.
The details say symbolication failed: the archived file is temporarily unreachable or corrupted, and the raw stack is shown. Try again later.
The error list is empty: check that the app is running an OTA version (the baseline bundle does not report) and that the client SDK is at least v10.55.0. Error data is kept for 31 days; older records are pruned.
Fewer frames mapped than the total: this is normal. Engine-internal frames like at map (native) have no source position at all. If many of your frames fail to map, the archived source map and the shipped bundle usually come from different builds.