
Analytics
After shipping an update, you need to know whether devices downloaded it, whether it activated, and where failures occurred. Cresc brings Overview, Version Funnel, Traffic and Failures together for each application, so you can investigate a rollout with the same context throughout.
Open Analytics in the console and select an app. Choose 7, 14 or 35 days at the top. The app, selected view and day range stay in the URL for sharing with your team.
Overview: understand traffic and outcomes
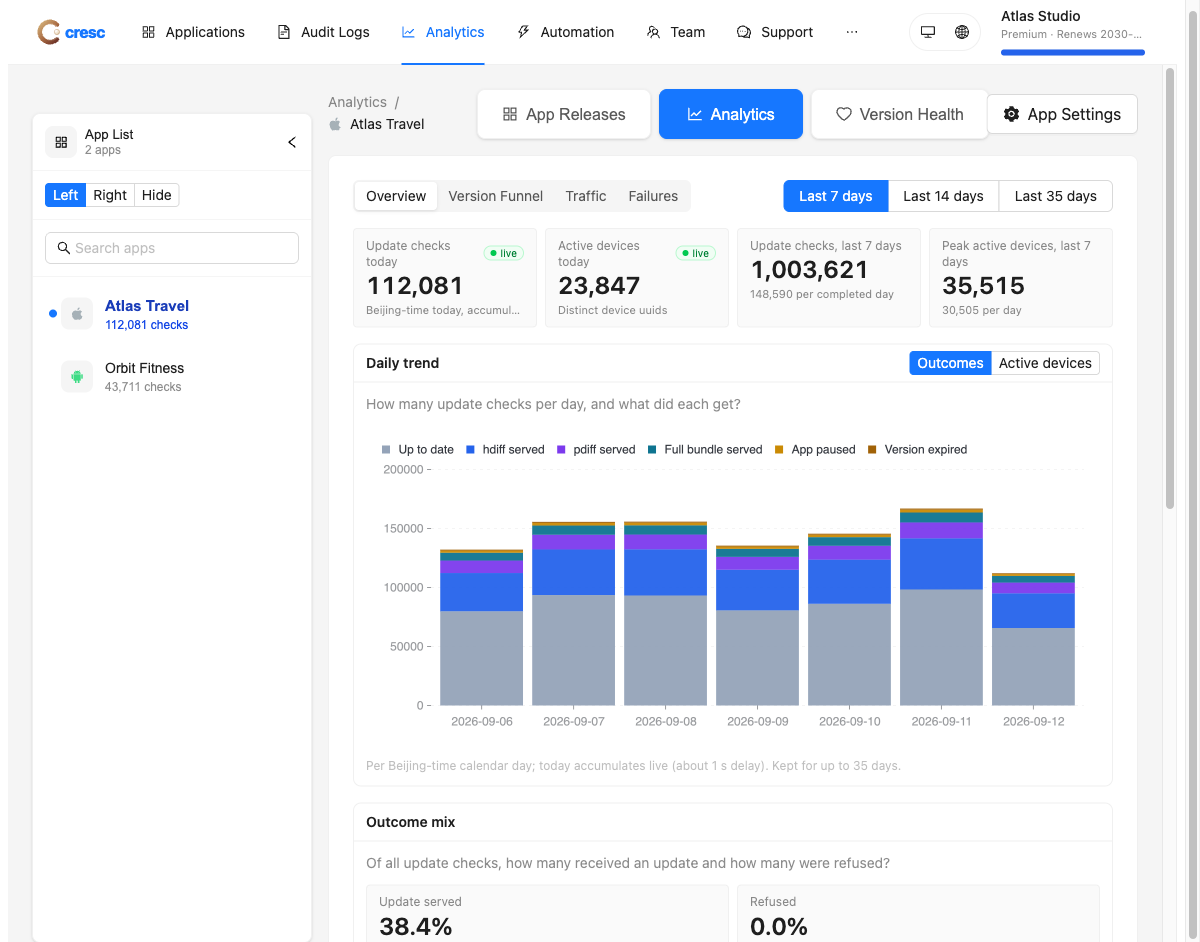
See today's update checks and active devices, total checks in the selected window, and peak daily active devices. Switch the daily chart between Outcomes and Active devices.
Below the chart, the outcome mix distinguishes up-to-date clients, hdiff and pdiff delivery, full bundles, paused apps, expired versions, blocked requests and unregistered native packages. Versions at a glance brings delivery, activation, cumulative activation rate, coverage and health together before you open the full funnel.
Active devices are distinct device uuids observed by the update service. They describe update-check activity; request volume is not a count of people using your application.
Version funnel: follow delivery through activation
For every OTA version, compare served → downloaded → activated → rolled back, alongside failures and rates. Filter by bundle or native package, then expand a version to see:
- Native-package breakdowns: delivery, downloads, activations, failures and rollbacks for each native version.
- Cumulative downloaded and activated devices: distinct-device adoption for the release.
- Time from release to download and activation: under 1 hour, 1–6 hours, 6–24 hours, 1–3 days, 3–7 days and over 7 days.
- Health: after at least 10 startup samples, a rollback rate of 1% or more is marked Watch; 5% or more is Critical. Consider sample size alongside the label.
version 4.8.1 has a higher rollback rate than 4.8.2. Filter that release, compare its native packages, and move to Failures to investigate its errors.
Read the rates correctly
Downloads and activations within a window may belong to different device cohorts. Dividing those event counts does not give a reliable adoption conversion rate. The cumulative activation rate uses a consistent distinct-device basis.
Traffic: inspect when and where checks happen
The Traffic view combines the real-time version chart with detailed breakdowns:
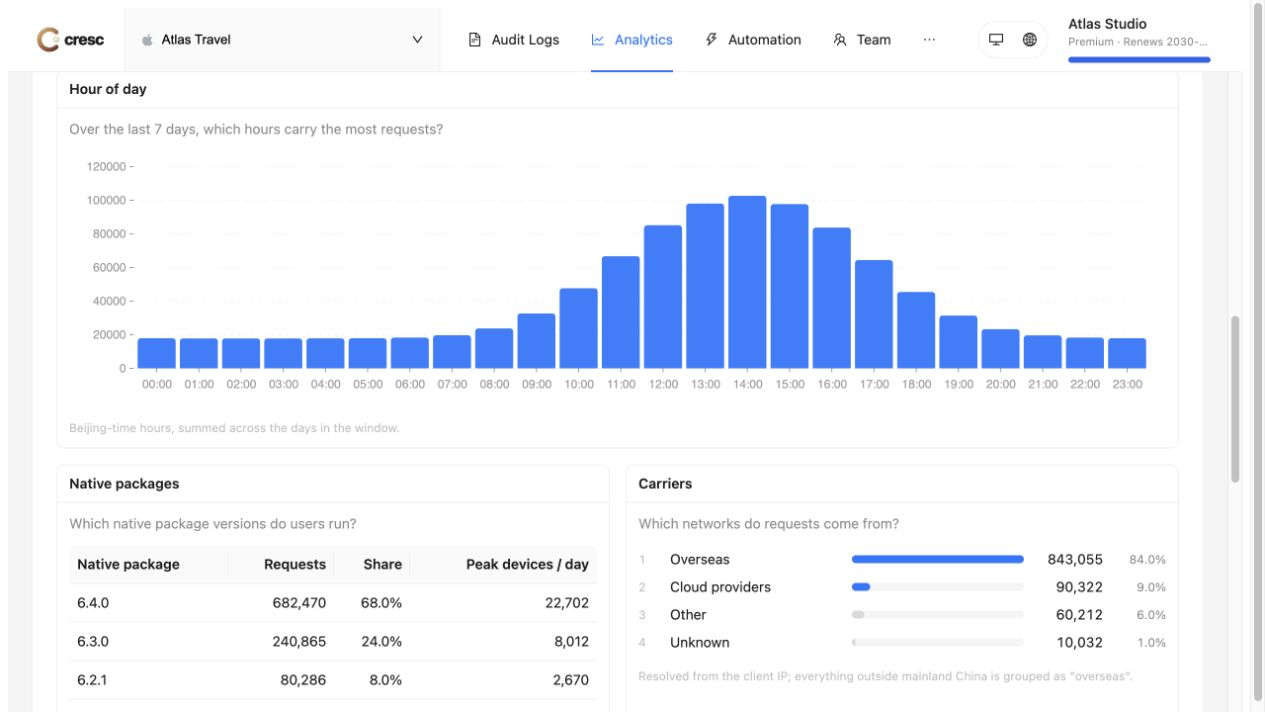
Regions have a separate Today / Last 7 days / Last 30 days selector. Names follow the console language. This is an IP-derived breakdown of completed update checks, not device-location tracking.
Native-package device counts show the peak single day in the window. Daily deduplicated counts cannot be added to obtain distinct devices across multiple days.
Failures: narrow the investigation
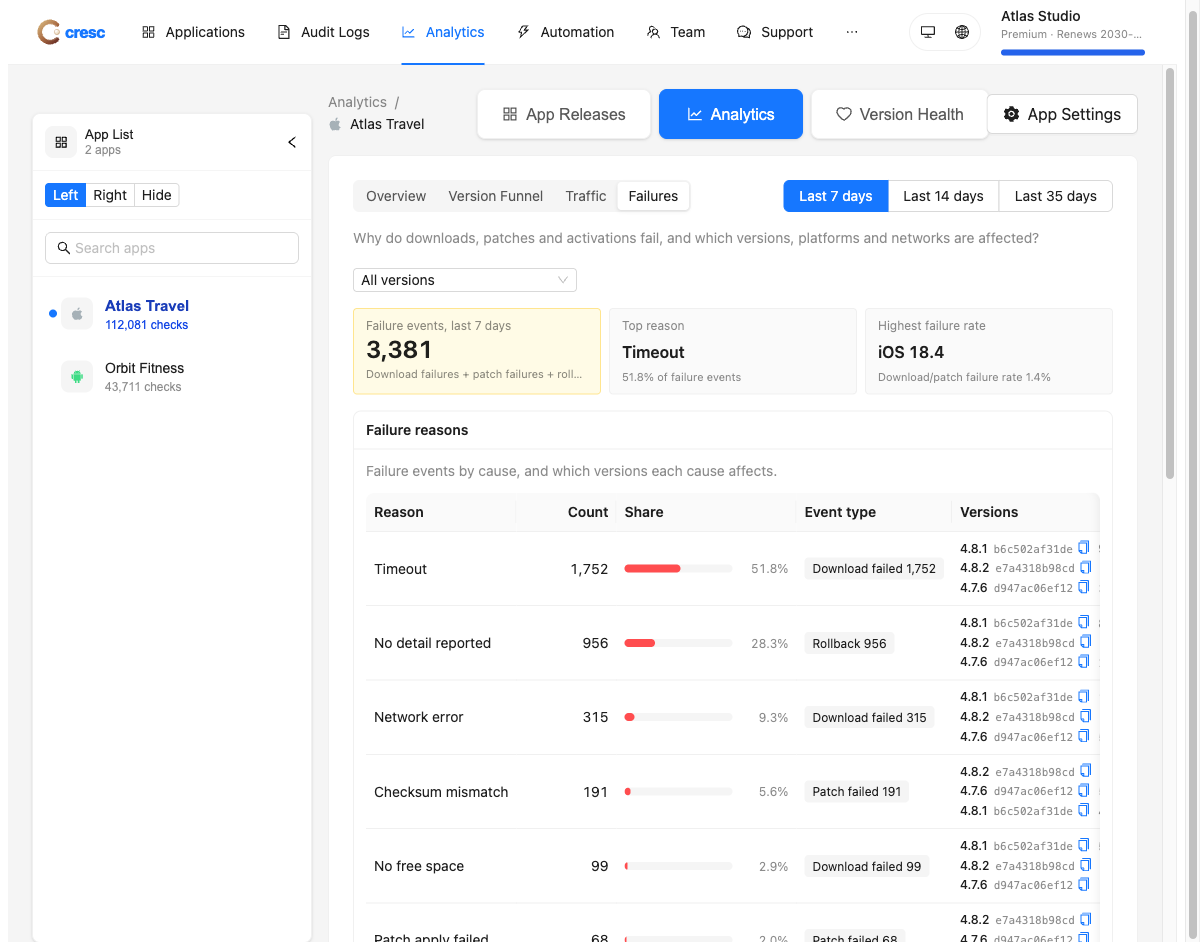
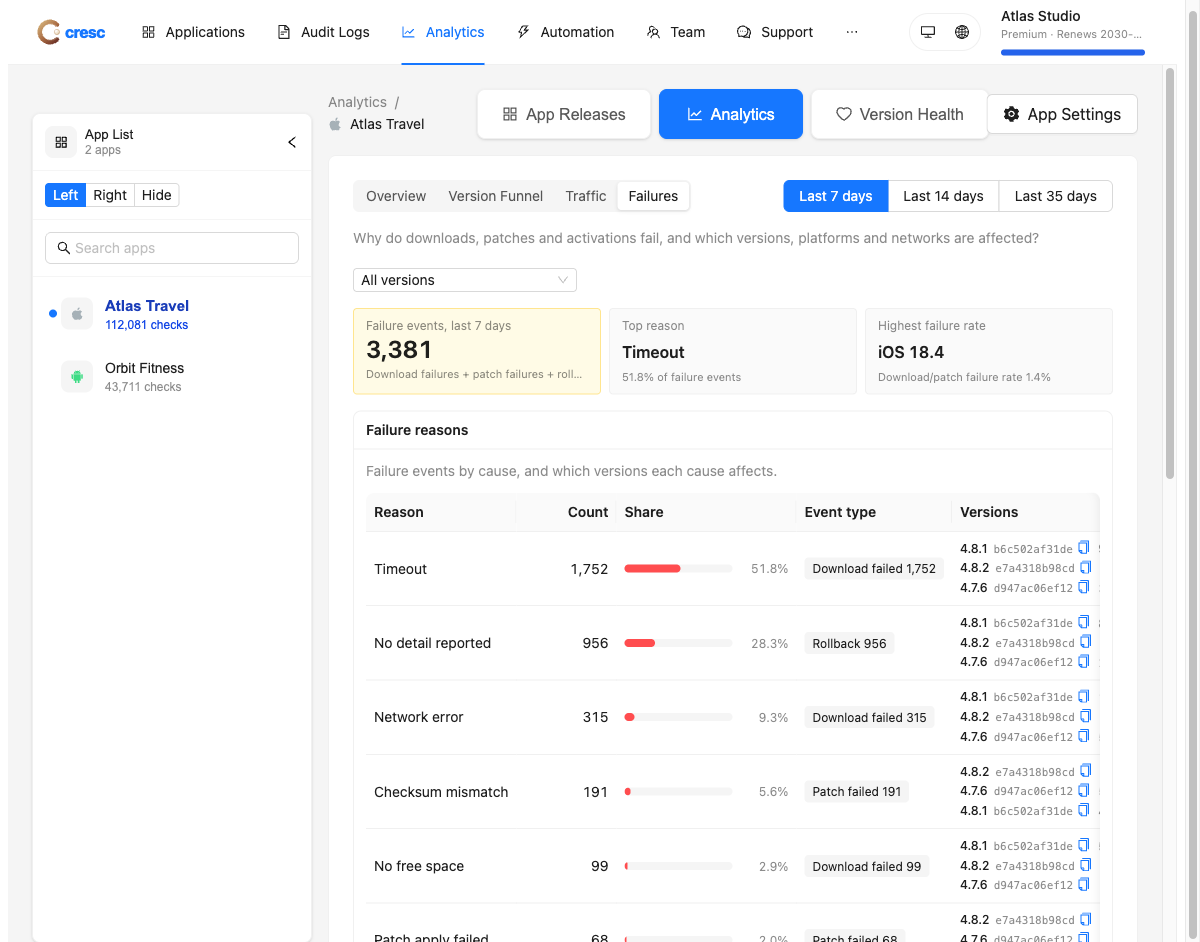
Start with total failure events, the most frequent reason and the OS version with the highest failure rate. The reason table includes counts, shares, event types and affected versions, with a bundle filter.
Reasons include timeouts, network errors, insufficient disk space, integrity mismatches, patch errors, HTTP errors, file I/O and unzip failures. Events without a reported reason stay in their own category rather than being assigned an inferred cause.
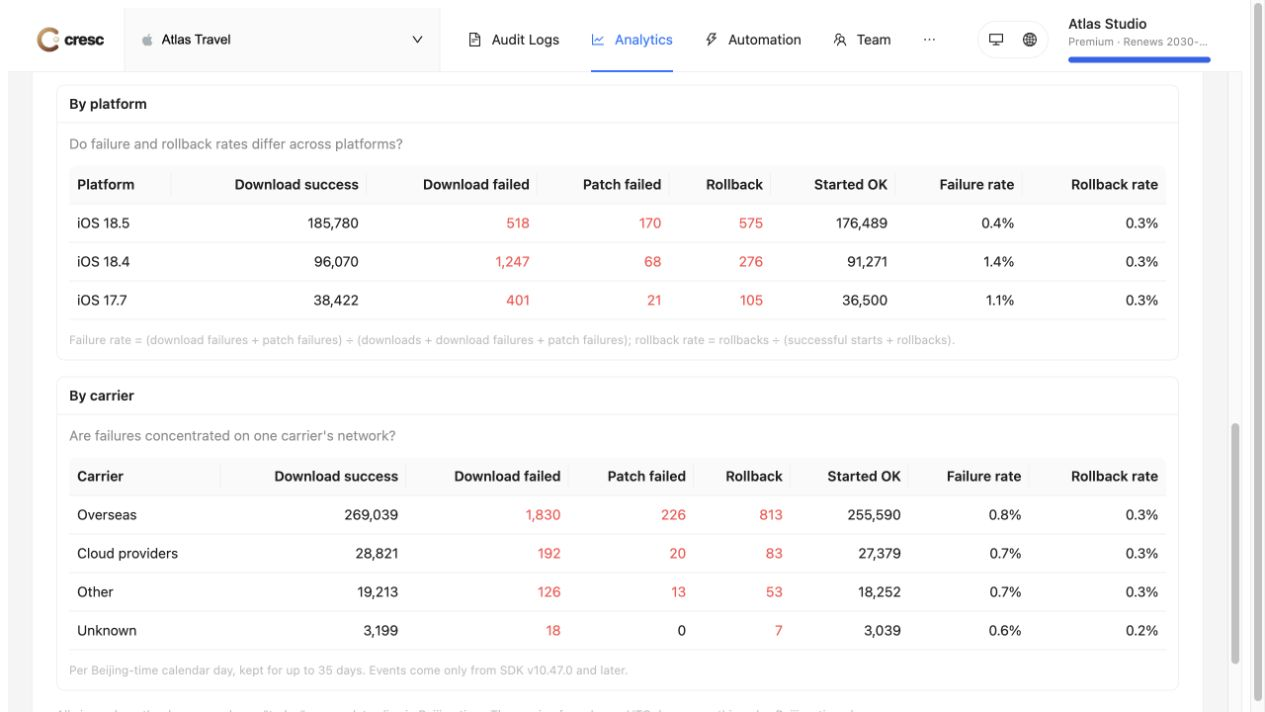
Compare events by OS version and network category to see whether failures concentrate in a particular environment. Carrier events do not currently have a bundle dimension: selecting one bundle displays that limitation instead of showing unfiltered carrier data as if it matched.
For JavaScript exceptions, continue to JS Error Monitoring under Version Health for grouped errors, environment details and symbolicated source stacks.
Time windows and collection
- Overview, Traffic and Failures use Beijing-time calendar days (UTC+8). Version-funnel event windows use UTC days.
- Today accumulates live and the page refreshes periodically. A partial day should not be compared directly with a completed day.
- Daily analytics are retained for up to 35 days; regional data for 30 days. The real-time series and regional panel have independent time selectors.
- Cumulative device counts and release-to-event lag do not change with the day range. Filtering a native package does not change those version-wide cumulative metrics.
- Device metrics depend on uuid reporting; client events depend on SDK telemetry. Missing telemetry is not evidence of zero failures. Distinct-device counts are approximate.
Start with traffic and outcomes, identify the affected release and native packages in the funnel, then use failure reasons and OS comparisons to focus your investigation. Together, the views help distinguish an update that was never served, one that failed to download, and one that downloaded but has not activated.